

As of March 31, 2026, the United States of America’s publicly held debt was $31.265 trillion. On the other hand, GDP over the preceding 12 months was $31.216 trillion. That puts the ratio of GDP to national debt at 100.2%, compared with 99.5% when the last fiscal year ended September 30. The Wall Street Journal reporter Richard Rubin called this “crossing a once-unthinkable threshold”.
Why be concerned?
What’s the significance of this number? Should we be worried? Is this an immediate issue? Our national debt has ballooned over the last several decades. Rubin wrote, “There isn’t a special level where debt goes from problematic to catastrophic,” but it doesn’t mean we shouldn’t be concerned about our debt levels. There is certainly reason to be.
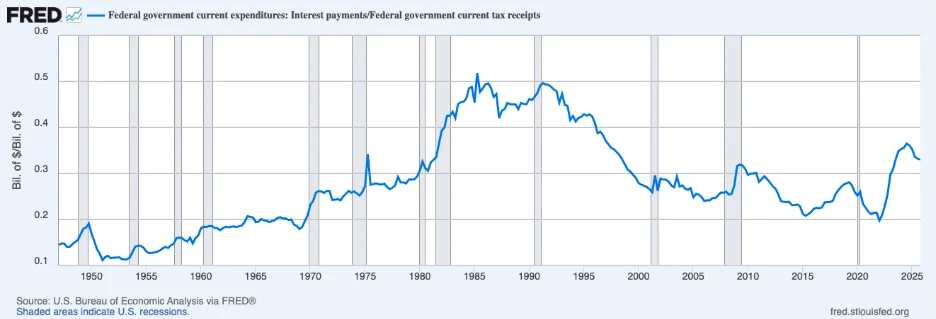
The higher our debt, the more interest we pay. Currently, about seven cents of every dollar brought in by the government goes to paying interest on that $31 trillion debt. Investors are understandably concerned. Federal deficits remain historically large, while rising interest rates have increased the cost of servicing that debt.
This also means the US administration may have less flexibility to combat a recession, finance a war, or handle an event like COVID, where federal expenses will likely soar and the revenue the government generates will be lower. There is also concern over what type of effect this will have on inflation, interest rates, and future taxes.
Is it always a crisis situation?
Why was 100% of GDP a once unthinkable number for national debt?
For most of modern history, debt equal to 100% of GDP sounded extreme because governments, economists, and investors used to think of national finances much more like household or business finances. If, as a household or a business, we owe more money than we earn, this can be problematic.
There are other factors making this number feel dangerous. Historically, countries threatened by economic collapse have often racked up significantly large debts and faced default or hyperinflation and political instability. None of those are in any way appealing, hence the concern with today’s numbers. Past examples include the debt crises in parts of Latin America during the 1980s and Greece after the global financial crisis of 2008-2009.
For much of the 20th century, “very high debt” was associated with wartime emergencies, not normal government operations. The last time the debt-to-GDP ratio exceeded current levels was in 1946, when debt reached more than 106% of GDP following World War II. That burden eventually lightened, but not because the government aggressively paid down debt – the levels came down due to the post-war economic expansion.
Other reasons economists get worried is that this heavy borrowing may crowd out private investment, weaken the US currency, and trigger inflation.
While a national debt equal to 100% of GDP is an uncomfortable milestone, what we’ve seen is that it’s not automatically a crisis. It means the government owes about as much as the country produces in a year. It’s important to separate the symbolism of crossing 100% debt-to-GDP from the actual near-term implications for markets and the economy. It does not necessarily tell us whether a debt burden has become unmanageable.
What’s the question to ask?
So, the important question isn’t necessarily what the number is; it’s more important to focus on whether the government can keep paying the interest comfortably and how fast the debt is growing relative to the economy. Who owns the debt and is the country running significant debt every year just to cover deficits, or is there a productive reason for a temporarily high borrowing?
Some economists are less alarmed about the size of our debt because if our economy grows faster than the interest on that debt, it becomes less significant. Many experts also point to US government bonds being in strong demand around the globe. The government is currently able to finance these debts easily in the marketplace. For now, market participants are focusing on its ability to service its debt, particularly the relationship between interest payments and tax receipts.
As the chart below shows, interest costs as a share of government revenues have risen meaningfully in recent years. However, they also remain below peaks reached during the 1980s and early 1990s, which were periods marked by elevated interest rates and fiscal concerns. At that time, the size of the US debt was a hotly debated topic and much more on voters’ minds than today.
Federal government interest payments as a share of federal tax receipts
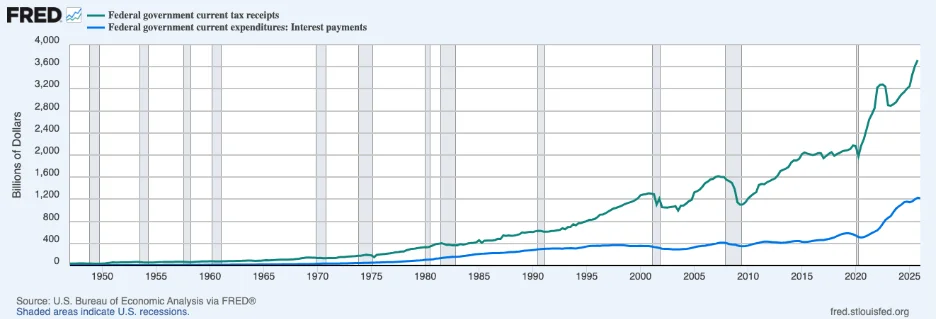
While this chart may not provide much mental relief, it does help provide some context. In my view, the chart below also provides some reasons for optimism. The government is projected to spend $2 trillion more this year than it brings in through tax receipts, but it will generate approximately $3.6 trillion in revenue. This number was unthinkable back in 2010 when receipts were barely $1 trillion, and it’s all because of economic growth. Without economic growth, without people making more money and paying more taxes, the revenue of the US government wouldn’t have tripled.
From this perspective, the problem appears more manageable. While getting federal spending back to levels seen just a few years ago would certainly prevent a deficit, not growing government spending by as much as the economy grows would also solve the issue over time (assuming capitalism continues to work and the country continues to grow its GDP).
What if?
US equity markets have risen throughout this period of rapid debt accumulation, and importantly, the 10-year Treasury yield remains below its long-term historical average. Demand for US Treasurys is still strong globally, supported by the dollar’s role as the world’s reserve currency and the Treasury market’s position at the center of the global financial system. I don’t think we’d see this type of reaction from markets if the 100% debt-to-GDP ratio was an especially meaningful metric. While we aren’t perfect, we remain the world’s cleanest dirty shirt.
So, this issue may not become pressing today or tomorrow, but it’s not something to be dismissive about. The long-term fiscal trajectory of the United States is an issue policymakers will eventually need to address, particularly as an aging population places additional pressure on programs like Social Security and Medicare. This comes at a time when political problems have become increasingly difficult to solve. The 10-year Treasury is likely where warnings signs will appear. If, at some point, demand for it softens beyond the supply, interest rates will rise. If that happens, the cost of servicing the debt will increase, and like in the 1980s and 1990s, we’ll have to make tough decisions as a county.
